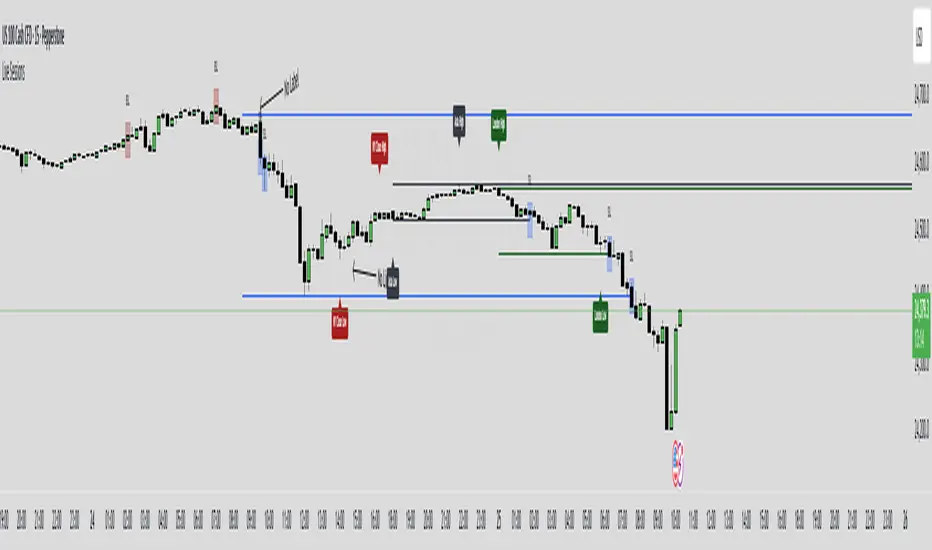
ORB-HL1. Opening Range Detection
Automatically calculates the high and low of the first 15 minutes after the selected session opens.
Supported sessions:
New York (Futures): 08:30–08:45 EST
New York (Equities): 09:30–09:45 EST
London: 03:00–03:15 GMT
Asia: 19:00–19:15 JST
Plots ORB high/low lines for the rest of the day.
2. Breakout Signals
Highlights the first valid breakout above or below the ORB range on the:
5-minute timeframe
15-minute timeframe
Green arrows = breakout up (long)
Red arrows = breakout down (short)
3. 1-Minute Projection
When a breakout is confirmed on a higher timeframe (5m or 15m), a projection label (e.g., "5m", "15m") appears on the 1-minute chart.
Purple label = 5m breakout
Teal label = 15m breakout
Helps you confirm momentum in real time while on the 1-minute chart.
4. Trailing Stop System
Uses ATR to create an adaptive trailing stop after breakout.
Turns green when price is above stop (bullish), red when below (bearish).
Optional Buy / Sell signal labels appear on crossover events.
5. Session High/Low Visualization
Tracks and displays the previous session’s High and Low for:
Tokyo
London
New York
Lines extend into the current session to act as S/R reference.
Labels like "NY High", "Asia Low" are placed at the end of each line.
6. Alerts
Built-in alerts for:
First 5m or 15m breakout (long/short)
Trailing stop Buy/Sell crossover
7. Customization Options
Turn session H/L lines on/off per session
Customize projection visibility
Adjust ATR period and sensitivity
Set how far each session line extends using bar offsets
ابحث في النصوص البرمجية عن "session high"

Time-based LiquidityThis indicator automatically marks important time-based liquidity levels on your chart, helping you stay aware of where major price reactions may occur and the market is forced to show its hand.
Key Features:
Previous Month’s, Week’s, and Day’s Highs and Lows: Displays PMH/PML, PWH/PWL, and PDH/PDL — key reference points where liquidity often accumulates.
Intraday Session Highs and Lows: Divides the trading day into quarters (00:00–06:00, 06:00–12:00, etc. following Day’s Quarterly Theory) and tracks session highs and lows dynamically across these periods.
Current Session 90-Minute Quarters: Splits the active session into 90-minute intervals to highlight short-term liquidity structures and potential reaction zones.
Level Alerts: Tracks when each liquidity level is reached and enables customizable alerts so you don’t miss important price movements.
Use Case:
This tool provides an organized, time-based framework for identifying where liquidity is likely to concentrate across different timeframes and intraday cycles. Use these levels for forming bias, planning entries, exits, or anticipating price reactions at key points in the market structure.
Customization Options:
Enable/disable liquidity levels to display (Daily, Weekly, Monthly, Sessions, Session Quarters)
Customize the appearance of each level (color, style, line width)
Enable or disable tracking and alerts for level interactions

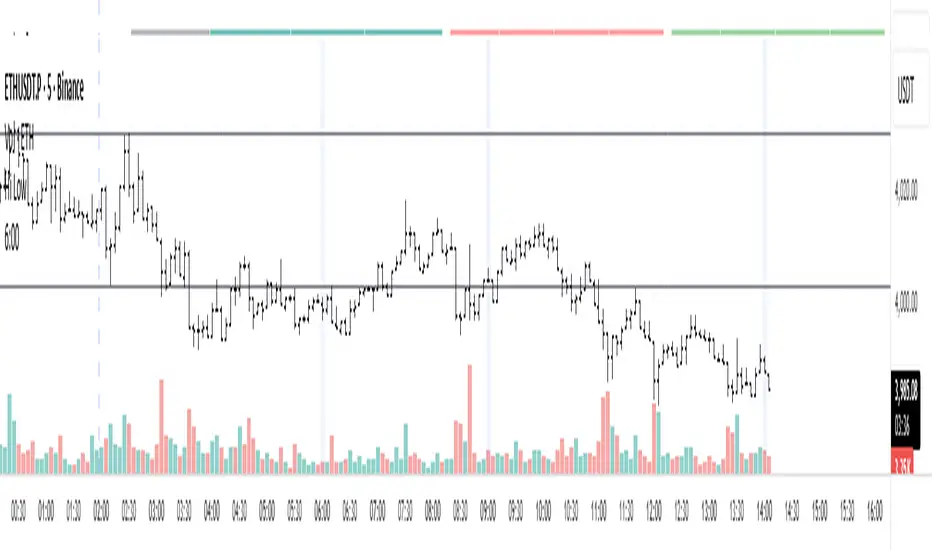
Market Session Boxes with Volume Delta [algo_aakash]This script highlights four key forex trading sessions — Tokyo, London, New York, and Sydney — by drawing color-coded boxes directly on the chart. For each session, it shows:
High and low of the session
Total volume traded
Volume delta (bullish vs bearish pressure)
Optional extension of session highs/lows into future candles
Cleanly labeled time range and stats
Users can:
Select which sessions to display
Customize session times (in UTC+0)
Choose colors per session
Toggle session labels and extension lines
Use Case: Designed to help intraday and short-term traders visualize market rhythm, liquidity zones, and session-based volatility. The volume delta metric adds an extra layer of sentiment analysis.
This tool works best on intraday timeframes like 15m, 30m, or 1H.
Disclaimer:
This indicator is for educational and visual analysis purposes. It does not constitute trading advice or guarantee results. Always conduct your own analysis before making trading decisions.

London Session 15-min Range – Clean AEST Timestamp Fix (w/ EMAs)London Session 15-min Range – Clean AEST Timestamp Fix (with EMAs)
What it does:
This script is made for traders who want to track the high and low of the first 15-minute candle of the London session, using AEST (UTC+10) as the time reference. It also plots the 50 EMA and 200 EMA to help identify trend direction.
How it works:
Session Timing:
The London session is defined as starting at 6:00 PM AEST.
The session ends at 2:00 AM AEST the next day.
Detects the first 15 minutes of the London session:
During this time, it records the highest and lowest price.
Draws lines once the 15-minute window is over:
A red horizontal line is drawn at the session high.
A green horizontal line is drawn at the session low.
These lines extend 50 bars into the future.
It only draws these once per day/session.
Includes EMAs:
A 50-period EMA is calculated and plotted in yellow.
A 200-period EMA is calculated and plotted in white.
Why use it:
It helps visualise important price levels from the start of the London session and pairs that with moving averages to spot trends or potential breakouts.

Live SessionsLive sessions plots the highs and lows of the previous for sessions.
It also marks when these are broken by price.
Default Time Frames are:
London Session = "0000-0600", "UTC-4"
New York Session = "0830-1230", "UTC-4"
Asia Session = "1800-0000", "UTC-4"
New York Close Session = "1330-1630", "UTC-4"
Useful for highlighting when price has gone through a previous session high or low and quickly seeing where liquidity still lies.
Casa_SessionsLibrary "Casa_Sessions"
Advanced trading session management library that enhances TradingView's default functionality:
Key Features:
- Accurate session detection for futures markets
- Custom session hour definitions
- Drop-in replacements for standard TradingView session functions
- Flexible session map customization
- Full control over trading windows and market hours
Perfect for traders who need precise session timing, especially when working
with futures markets or custom trading schedules.
SetSessionTimes(session_type_input, custom_session_times_input, syminfo_type, syminfo_root, syminfo_timezone)
Parameters:
session_type_input (simple string) : Input string for session selection:
- 'Custom': User-defined session times
- 'FX-Tokyo': Tokyo forex session
- 'FX-London': London forex session
- 'FX-New York': NY forex session
- 'Overnight Session (ON)': After-hours trading
- 'Day Session (RTH)': Regular trading hours
custom_session_times_input (simple string) : Session parameter for custom time windows
Only used when session_type_input is 'Custom'
syminfo_type (simple string)
syminfo_root (simple string)
syminfo_timezone (simple string)
Returns:
session_times: Trading hours for selected session
session_timezone: Market timezone (relevant for forex)
getSessionMap()
Get futures trading session hours map
Keys are formatted as 'symbol:session', examples:
- 'ES:market' - Regular trading hours (RTH)
- 'ES:overnight' - Extended trading hours (ETH)
- 'NQ:market' - NASDAQ futures RTH
- 'CL:overnight' - Crude Oil futures ETH
Returns: Map
Key: Symbol:session identifier
Value: Session hours in format "HH:MM-HH:MM"
getSessionString(session, symbol, sessionMap)
Returns a session string representing the session hours (and days) for the requested symbol (or the chart's symbol if the symbol value is not provided). If the session string is not found in the collection, it will return a blank string.
Parameters:
session (string) : A string representing the session hour being requested. One of: market (regular trading hours), overnight (extended/electronic trading hours), postmarket (after-hours), premarket
symbol (string) : The symbol to check. Optional. Defaults to chart symbol.
sessionMap (map) : The map of futures session hours. Optional. Uses default if not provided.
inSession(session, sessionMap, barsBack)
Returns true if the current symbol is currently in the session parameters defined by sessionString.
Parameters:
session (string) : A string representing the session hour being requested. One of: market (regular trading hours), overnight (extended/electronic trading hours), postmarket (after-hours), premarket
sessionMap (map) : The map of futures session hours. Optional. Uses default if not provided.
barsBack (int) : Private. Only used by futures to check islastbar. Optional. The default is 0.
ismarket(sessionMap)
Returns true if the current bar is a part of the regular trading hours (i.e. market hours), false otherwise. Works for futures (TradingView's methods do not).
Parameters:
sessionMap (map) : The map of futures session hours. Optional. Uses default if not provided.
Returns: bool
isfirstbar()
Returns true if the current bar is the first bar of the day's session, false otherwise. If extended session information is used, only returns true on the first bar of the pre-market bars. Works for futures (TradingView's methods do not).
Returns: bool
islastbar()
Returns true if the current bar is the last bar of the day's session, false otherwise. If extended session information is used, only returns true on the last bar of the post-market bars. Works for futures (TradingView's methods do not).
Returns: bool
ispremarket(sessionMap)
Returns true if the current bar is a part of the pre-market, false otherwise. On non-intraday charts always returns false. Works for futures (TradingView's methods do not).
Parameters:
sessionMap (map) : The map of futures session hours. Optional. Uses default if not provided.
Returns: bool
ispostmarket(sessionMap)
Returns true if the current bar is a part of the post-market, false otherwise. On non-intraday charts always returns false. Works for futures (TradingView's methods do not).
Parameters:
sessionMap (map) : The map of futures session hours. Optional. Uses default if not provided.
Returns: bool
isfirstbar_regular(sessionMap)
Returns true on the first regular session bar of the day, false otherwise. The result is the same whether extended session information is used or not. Works for futures (TradingView's methods do not).
Parameters:
sessionMap (map) : The map of futures session hours. Optional. Uses default if not provided.
Returns: bool
islastbar_regular(sessionMap)
Returns true on the last regular session bar of the day, false otherwise. The result is the same whether extended session information is used or not. Works for futures (TradingView's methods do not).
Parameters:
sessionMap (map) : The map of futures session hours. Optional. Uses default if not provided.
Returns: bool
isovernight(sessionMap)
Returns true if the current bar is a part of the pre-market or post-market, false otherwise. On non-intraday charts always returns false.
Parameters:
sessionMap (map) : The map of futures session hours. Optional. Uses default if not provided.
Returns: bool
getSessionHighAndLow(session, sessionMap)
Returns a tuple containing the high and low print during the specified session.
Parameters:
session (string) : The session for which to get the high & low prints. Defaults to market.
sessionMap (map) : The map of futures session hours. Optional. Uses default if not provided.
Returns: A tuple containing
getSessionHigh(session, sessionMap)
Convenience function to return the session high. Necessary if you want to call this function from within a request.security expression where you can't return a tuple.
Parameters:
session (string) : The session for which to get the high & low prints. Defaults to market.
sessionMap (map) : The map of futures session hours. Optional. Uses default if not provided.
Returns: The high of the session
getSessionLow(session, sessionMap)
Convenience function to return the session low. Necessary if you want to call this function from within a request.security expression where you can't return a tuple.
Parameters:
session (string) : The session for which to get the high & low prints. Defaults to market.
sessionMap (map) : The map of futures session hours. Optional. Uses default if not provided.
Returns: The low of the session

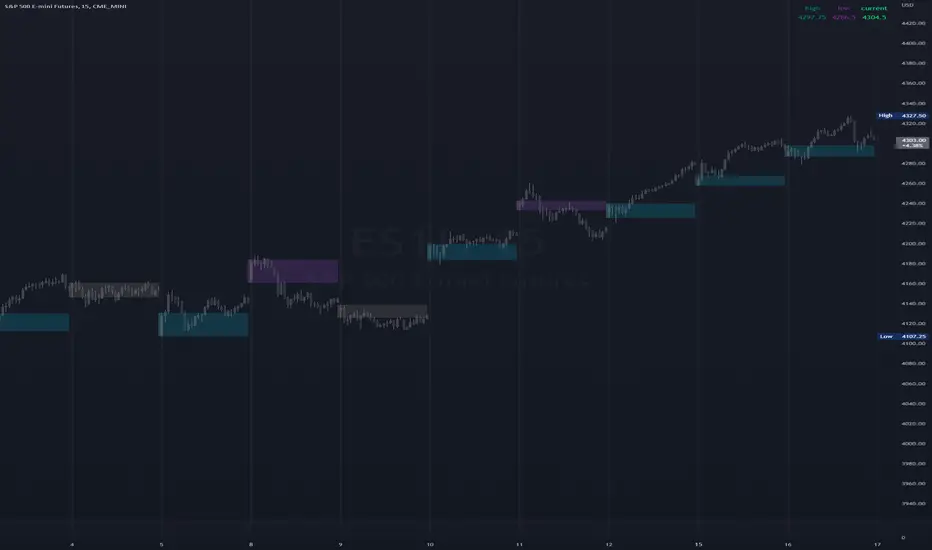
Globex Trap ZoneGlobex Trap Indicator
A powerful tool designed to identify potential trading opportunities by analyzing the relationship between Globex session ranges and Supply & Demand zones during regular trading hours.
Key Features
Tracks and visualizes Globex session price ranges
Identifies key Supply & Demand zones during regular trading hours
Highlights potential trap areas where price might experience significant reactions
Fully customizable time ranges and visual settings
Clear labeling of Globex highs and lows
How It Works
The indicator tracks two key periods:
Globex Session (Default: 6:00 PM - 9:30 AM)
Monitors overnight price action
Marks session high and low
Helps identify potential range breakouts
Supply & Demand Zone (Default: 8:00 AM - 11:00 AM)
Tracks price action during key market hours
Identifies potential reaction zones
Helps spot institutional trading areas
Best Practices for Using This Indicator
Use on 1-hour timeframe or lower for optimal visualization
Best suited for futures and other instruments traded during Globex sessions
Pay attention to areas where Globex range and Supply/Demand zones overlap
Use in conjunction with your existing trading strategy for confirmation
Recommended minimum of 10 days of historical data for context
Settings Explanation
Globex Session: Customizable time range for overnight trading session
Supply & Demand Zone: Adjustable time range for regular trading hours
Days to Look Back: Number of historical days to display (default: 10)
Visual Settings: Customizable colors and transparency for both zones
Important Notes
All times are based on exchange timezone
The indicator respects overnight sessions and properly handles timezone transitions
Historical data requirements: Minimum 10 days recommended
Performance impact: Optimized for smooth operation with minimal resource usage
Disclaimer
Past performance is not indicative of future results. This indicator is designed to be used as part of a comprehensive trading strategy and should not be relied upon as the sole basis for trading decisions.
Updates and Support
I actively maintain this indicator and welcome feedback from the trading community. Please feel free to leave comments or suggestions for improvements.

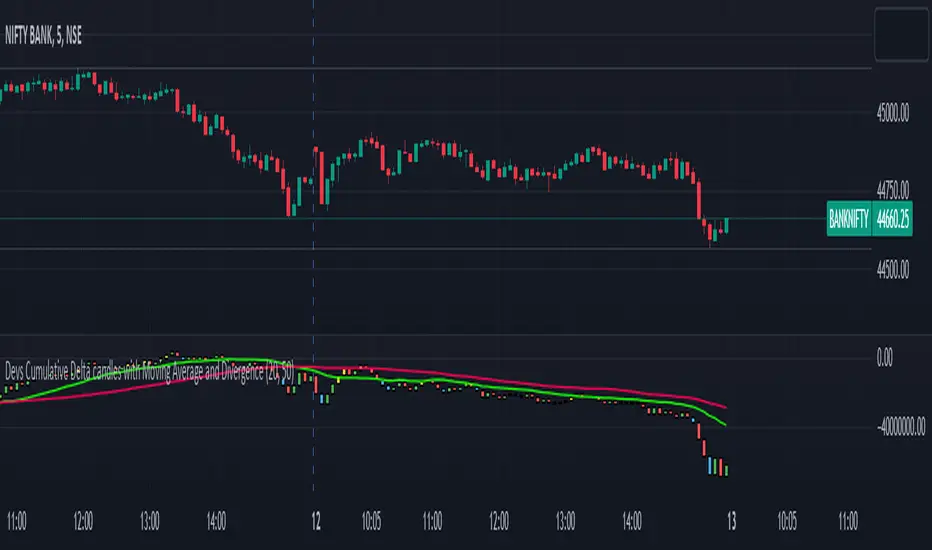
Devs Cumulative Delta candles with Moving Average and DivergenceDELTA = BUY Volume – SELL Volumes
Delta = Positive => Aggressiveness on the Buy side
Delta = Negative => Aggressiveness on the Sell side
If delta is greater than 0 you have more buying than selling pressure. If delta is less than 0, you have more selling than buying pressure.
When there is more Buying than Selling (Delta=Positive), the price candle is Green and when there is more Selling than Buying (Delta=Negative), the price candle is Red. We use delta to understand the relationship between buying or selling pressure and price.
Let’s imagine a price bar that reached the low for the day but delta was actually positive and the bar closed higher than it opened.
In simple terms we can describe this as:
Price made a new low
The bar closed higher
Delta demonstrated more buying than selling : Volume delta is a key metric to understand when making trading decisions based on volume and order flow. However, on its own it can be too much information to interpret quickly when trading in a volatile market.
What are Delta Bars?
Delta Bars is a candlestick representation of Delta. In other words, it has an Open, High (also called Delta Max), Low (also called Delta Min) and Close point in every candle (1min, 5min, 30min etc.)
The Delta Open in every candle is always 0
The Delta Close is the cumulative BUY less cumulative SELL at the close if the candle
The Delta Max is the maximum value of Delta during the candle session (lowest Delta Max possible = 0)
The Delta Min is the minimum value of Delta during the candle session (highest Delta Min possible = 0) The Delta bars are uncorrelated to the Tick Multiplier of the symbol.
Generally you would expect Price to move UP when Delta is positive and Price to move DOWN when Delta is negative. So what happens when the above rule is not followed. We have Divergence
Divergence:
Any two parameters that should be in sync (Price and Delta in this case) towards supporting a particular move (Up or Down) but are in reality not (in sync) form a Divergence
Cumulative volume delta takes the delta values for every bar and successively adds them together to visually provide as seen in the chart.
While volume delta is great for comparing delta bar to bar, cumulative volume delta is useful when determining buying or selling pressure at different price levels such as swing highs or lows. I just gave you a details regarding delta and delta bars.
What details would you see in the indicator??
When you apply this indicator on the chart, you will find the CD(Cumulative delta) candles, which move up and down the way price moves in a chart. Moreover, in case of a divergence, you will find a change in colour of delta candles. If the price is still green but the delta is negative, you will find a bullish divergence, marked with Yellow colour and if the price is red and you have a positive delta, you will have a bearish divergence, marked with blue coloured delta candle. Usually it has been seen that a repeated divergence generally depicts end of a trend or slow down of a trend.
Moreover, I have placed 2 moving averages in the script which you can customize as per your needs. I prefer 20 and 50 day MA for better accuracy as most reversals happen at 20 and 50 day MA.
This indicator works in almost all index, stocks, currencies excepting few where the volume past is invisible. This indicator purely works taking the buying and selling volume into consideration. Sometimes when you change the timeframe in chart, you may have to manually adjust for the display in chart.
Traders_Reality_LibLibrary "Traders_Reality_Lib"
This library contains common elements used in Traders Reality scripts
calcPvsra(pvsraVolume, pvsraHigh, pvsraLow, pvsraClose, pvsraOpen, redVectorColor, greenVectorColor, violetVectorColor, blueVectorColor, darkGreyCandleColor, lightGrayCandleColor)
calculate the pvsra candle color and return the color as well as an alert if a vector candle has apperared.
Situation "Climax"
Bars with volume >= 200% of the average volume of the 10 previous chart TFs, or bars
where the product of candle spread x candle volume is >= the highest for the 10 previous
chart time TFs.
Default Colors: Bull bars are green and bear bars are red.
Situation "Volume Rising Above Average"
Bars with volume >= 150% of the average volume of the 10 previous chart TFs.
Default Colors: Bull bars are blue and bear are violet.
Parameters:
pvsraVolume : the instrument volume series (obtained from request.sequrity)
pvsraHigh : the instrument high series (obtained from request.sequrity)
pvsraLow : the instrument low series (obtained from request.sequrity)
pvsraClose : the instrument close series (obtained from request.sequrity)
pvsraOpen : the instrument open series (obtained from request.sequrity)
redVectorColor : red vector candle color
greenVectorColor : green vector candle color
violetVectorColor : violet/pink vector candle color
blueVectorColor : blue vector candle color
darkGreyCandleColor : regular volume candle down candle color - not a vector
lightGrayCandleColor : regular volume candle up candle color - not a vector
@return
adr(length, barsBack)
Parameters:
length : how many elements of the series to calculate on
barsBack : starting possition for the length calculation - current bar or some other value eg last bar
@return adr the adr for the specified lenght
adrHigh(adr, fromDo)
Calculate the ADR high given an ADR
Parameters:
adr : the adr
fromDo : boolean flag, if false calculate traditional adr from high low of today, if true calcualte from exchange midnight
@return adrHigh the position of the adr high in price
adrLow(adr, fromDo)
Parameters:
adr : the adr
fromDo : boolean flag, if false calculate traditional adr from high low of today, if true calcualte from exchange midnight
@return adrLow the position of the adr low in price
splitSessionString(sessXTime)
given a session in the format 0000-0100:23456 split out the hours and minutes
Parameters:
sessXTime : the session time string usually in the format 0000-0100:23456
@return
calcSessionStartEnd(sessXTime, gmt)
calculate the start and end timestamps of the session
Parameters:
sessXTime : the session time string usually in the format 0000-0100:23456
gmt : the gmt offset string usually in the format GMT+1 or GMT+2 etc
@return
drawOpenRange(sessXTime, sessXcol, showOrX, gmt)
draw open range for a session
Parameters:
sessXTime : session string in the format 0000-0100:23456
sessXcol : the color to be used for the opening range box shading
showOrX : boolean flag to toggle displaying the opening range
gmt : the gmt offset string usually in the format GMT+1 or GMT+2 etc
@return void
drawSessionHiLo(sessXTime, show_rectangleX, show_labelX, sessXcolLabel, sessXLabel, gmt, sessionLineStyle)
Parameters:
sessXTime : session string in the format 0000-0100:23456
show_rectangleX : show the session high and low lines
show_labelX : show the session label
sessXcolLabel : the color to be used for the hi/low lines and label
sessXLabel : the session label text
gmt : the gmt offset string usually in the format GMT+1 or GMT+2 etc
sessionLineStyle : the line stile for the session high low lines
@return void
calcDst()
calculate market session dst on/off flags
@return indicating if DST is on or off for a particular region
timestampPreviousDayOfWeek(previousDayOfWeek, hourOfDay, gmtOffset, oneWeekMillis)
Timestamp any of the 6 previous days in the week (such as last Wednesday at 21 hours GMT)
Parameters:
previousDayOfWeek : Monday or Satruday
hourOfDay : the hour of the day when psy calc is to start
gmtOffset : the gmt offset string usually in the format GMT+1 or GMT+2 etc
oneWeekMillis : the amount if time for a week in milliseconds
@return the timestamp of the psy level calculation start time
getdayOpen()
get the daily open - basically exchange midnight
@return the daily open value which is float price
newBar(res)
new_bar: check if we're on a new bar within the session in a given resolution
Parameters:
res : the desired resolution
@return true/false is a new bar for the session has started
toPips(val)
to_pips Convert value to pips
Parameters:
val : the value to convert to pips
@return the value in pips
rLabel(ry, rtext, rstyle, rcolor, valid, labelXOffset)
a function that draws a right aligned lable for a series during the current bar
Parameters:
ry : series float the y coordinate of the lable
rtext : the text of the label
rstyle : the style for the lable
rcolor : the color for the label
valid : a boolean flag that allows for turning on or off a lable
labelXOffset : how much to offset the label from the current position
rLabelOffset(ry, rtext, rstyle, rcolor, valid, labelXOffset)
a function that draws a right aligned lable for a series during the current bar
Parameters:
ry : series float the y coordinate of the lable
rtext : the text of the label
rstyle : the style for the lable
rcolor : the color for the label
valid : a boolean flag that allows for turning on or off a lable
labelXOffset : how much to offset the label from the current position
rLabelLastBar(ry, rtext, rstyle, rcolor, valid, labelXOffset)
a function that draws a right aligned lable for a series only on the last bar
Parameters:
ry : series float the y coordinate of the lable
rtext : the text of the label
rstyle : the style for the lable
rcolor : the color for the label
valid : a boolean flag that allows for turning on or off a lable
labelXOffset : how much to offset the label from the current position
drawLine(xSeries, res, tag, xColor, xStyle, xWidth, xExtend, isLabelValid, labelXOffset, validTimeFrame)
a function that draws a line and a label for a series
Parameters:
xSeries : series float the y coordinate of the line/label
res : the desired resolution controlling when a new line will start
tag : the text for the lable
xColor : the color for the label
xStyle : the style for the line
xWidth : the width of the line
xExtend : extend the line
isLabelValid : a boolean flag that allows for turning on or off a label
labelXOffset : how much to offset the label from the current position
validTimeFrame : a boolean flag that allows for turning on or off a line drawn
drawLineDO(xSeries, res, tag, xColor, xStyle, xWidth, xExtend, isLabelValid, labelXOffset, validTimeFrame)
a function that draws a line and a label for the daily open series
Parameters:
xSeries : series float the y coordinate of the line/label
res : the desired resolution controlling when a new line will start
tag : the text for the lable
xColor : the color for the label
xStyle : the style for the line
xWidth : the width of the line
xExtend : extend the line
isLabelValid : a boolean flag that allows for turning on or off a label
labelXOffset : how much to offset the label from the current position
validTimeFrame : a boolean flag that allows for turning on or off a line drawn
drawPivot(pivotLevel, res, tag, pivotColor, pivotLabelColor, pivotStyle, pivotWidth, pivotExtend, isLabelValid, validTimeFrame, levelStart, pivotLabelXOffset)
draw a pivot line - the line starts one day into the past
Parameters:
pivotLevel : series of the pivot point
res : the desired resolution
tag : the text to appear
pivotColor : the color of the line
pivotLabelColor : the color of the label
pivotStyle : the line style
pivotWidth : the line width
pivotExtend : extend the line
isLabelValid : boolean param allows to turn label on and off
validTimeFrame : only draw the line and label at a valid timeframe
levelStart : basically when to start drawing the levels
pivotLabelXOffset : how much to offset the label from its current postion
@return the pivot line series
getPvsraFlagByColor(pvsraColor, redVectorColor, greenVectorColor, violetVectorColor, blueVectorColor, lightGrayCandleColor)
convert the pvsra color to an internal code
Parameters:
pvsraColor : the calculated pvsra color
redVectorColor : the user defined red vector color
greenVectorColor : the user defined green vector color
violetVectorColor : the user defined violet vector color
blueVectorColor : the user defined blue vector color
lightGrayCandleColor : the user defined regular up candle color
@return pvsra internal code
updateZones(pvsra, direction, boxArr, maxlevels, pvsraHigh, pvsraLow, pvsraOpen, pvsraClose, transperancy, zoneupdatetype, zonecolor, zonetype, borderwidth, coloroverride, redVectorColor, greenVectorColor, violetVectorColor, blueVectorColor, lightGrayCandleColor)
a function that draws the unrecovered vector candle zones
Parameters:
pvsra : internal code
direction : above or below the current pa
boxArr : the array containing the boxes that need to be updated
maxlevels : the maximum number of boxes to draw
pvsraHigh : the pvsra high value series
pvsraLow : the pvsra low value series
pvsraOpen : the pvsra open value series
pvsraClose : the pvsra close value series
transperancy : the transparencfy of the vecor candle zones
zoneupdatetype : the zone update type
zonecolor : the zone color if overriden
zonetype : the zone type
borderwidth : the width of the border
coloroverride : if the color overriden
redVectorColor : the user defined red vector color
greenVectorColor : the user defined green vector color
violetVectorColor : the user defined violet vector color
blueVectorColor : the user defined blue vector color
lightGrayCandleColor : the user defined regular up candle color
cleanarr(arr)
clean an array from na values
Parameters:
arr : the array to clean
@return if the array was cleaned
calcPsyLevels(oneWeekMillis, showPsylevels, psyType, sydDST)
calculate the psy levels
4 hour res based on how mt4 does it
mt4 code
int Li_4 = iBarShift(NULL, PERIOD_H4, iTime(NULL, PERIOD_W1, Li_0)) - 2 - Offset;
ObjectCreate("PsychHi", OBJ_TREND, 0, Time , iHigh(NULL, PERIOD_H4, iHighest(NULL, PERIOD_H4, MODE_HIGH, 2, Li_4)), iTime(NULL, PERIOD_W1, 0), iHigh(NULL, PERIOD_H4,
iHighest(NULL, PERIOD_H4, MODE_HIGH, 2, Li_4)));
so basically because the session is 8 hours and we are looking at a 4 hour resolution we only need to take the highest high an lowest low of 2 bars
we use the gmt offset to adjust the 0000-0800 session to Sydney open which is at 2100 during dst and at 2200 otherwize. (dst - spring foward, fall back)
keep in mind sydney is in the souther hemisphere so dst is oposite of when london and new york go into dst
Parameters:
oneWeekMillis : a constant value
showPsylevels : should psy levels be calculated
psyType : the type of Psylevels - crypto or forex
sydDST : is Sydney in DST
@return

High & Low Of Custom SessionThis script boxes a custom session and sets the box at the high and low of the session and draws that box to the next session.
Box color is determined by price in relation to the box position. Box color is set at the start of the next session. This allows
user to lookback at multiple box sets to see how each day closed in relation to the session highlighted.
I have written this for backtesting purposes and intend to expand it to use with volume analysis and gradient color to change the box color based on how many times price tests
the box.
ICT Index Futures Vertical LinesLearning to trade is complicated enough, so to make the process it little less daunting, I decided to create something helpful.
This indicator relieves you of drawing the same lines and levels over and over each trading day.
It also provides key price levels for you to watch when the trading session starts.
This project is inspired by the ICT 2022 Mentorship.
This indicator was designed and tested to practice and trade the CME Index Futures like Nasdaq, S&P500 and the DOW.
The concepts by ICT are known to work on other markets like Crypto, but I haven't tested that so use at your own risk.
Features:
When a new trading day starts, the following lipstick is put on the chart:
Vertical lines:
- Globex (Overnight) Session Start @17.00
- New York Midnight @ 00:00
- New York AM Session Start @ 08.30
- CME Open @ 09.30
- New York Lunch Start @12.00
- New York PM Session Start @13.00
- New York PM Session End @ 16.30
Important levels:
- Globex (Overnight) Session Opening price
- Globex (Overnight) Session High
- Globex (Overnight) Session Low
- New York Mignight Opening Price
Additional features:
- Shows the day of the week at the bottom for your convenience
- London Killzone Vertical lines
- London Killzone Highlight
- NY Lunch No-Trade-Zone Highlight
- Important levels have a small label to show their meaning and price
- Almost everything is customizable: colors, line types, times, etc
- Customizable timezone setting in case you don't want to work on ICT's recommended timezone (New York UTC-4)
- Toggle to Show only Today's drawings on the chart. You can choose to display all chart lipstick from almost a month of trading data to do your research. Ideal if you want to determine the daily profiles for example.
Screenshots:
London Killzone Highlight turned on:
Multi Day Lipstick:

VX-Session-Boxes-(AM/PM Split)(Customizable) by Ikaru-s-VX-Session-Boxes-(AM/PM Split) is a session-based visualization tool for TradingView that highlights major market sessions directly on the chart using dotted range boxes and an optional AM/PM split.
The indicator allows traders to visually separate market behavior across different sessions while keeping the chart clean and readable.
🔹 Key Features
Custom Session Definitions
Define up to 4 independent sessions using TradingView’s session format (HHMM-HHMM + weekdays).
Timezone-Aware
All sessions are calculated using a user-defined timezone (IANA or UTC offset), ensuring accurate session alignment across markets.
Dotted Session Boxes
Each session is drawn as a dotted box based on the session’s high/low range, providing a clear view of volatility and price structure.
AM / PM Split Visualization
Sessions can be visually split into AM and PM parts:
Separate box shading for AM and PM
Optional dotted vertical split line at the AM → PM transition (12:00 in the selected timezone)
Session Labels
Optional labels at the start of each session for quick identification (e.g. Sydney, Tokyo, London, New York).
Fully Customizable Visuals
Adjustable opacity, border width, and visibility toggles for boxes, split lines, and labels.
🔹 Use Cases
Session-based market analysis (Asia / London / New York)
Identifying session ranges and volatility expansion
Observing price behavior differences between AM and PM
Studying session transitions and liquidity shifts
🔹 Notes
Session boxes are based on session high and low, not full chart height.
AM/PM split is based on 12:00 (noon) in the selected timezone.
Designed for clarity and performance on intraday timeframes.
🔹 Compatibility
Pine Script® v6
Works on all intraday timeframes
Overlay indicator (draws directly on the price chart)

Prime-Time × Vortex (3/6/9) — Ace (clean v3)1️⃣ Prime-Time Index (PT)
A bar becomes Prime-Time when the count satisfies the formula:
4·n − 3 is a perfect square
This generates the sequence:
1, 3, 7, 13, 21, 31, 43, 57, 73, 91, …
These are time windows where price is more likely to form:
Shifts in market structure
Impulses
Reversals
Liquidity expansions
These PT bars are drawn as small circles above the candle.
If labels are enabled, the counter value (n) is also shown.
2️⃣ Vortex 3/6/9 Digital-Root Timing
Every bar also has a digital root, calculated from the counter:
If n → digitalRoot(n) = 3, 6, or 9,
the bar is considered a Vortex bar.
These moments often align with:
Swing highs / swing lows
Micro shifts
Mini-reversals
Minor liquidity grabs
When a Prime-Time bar is also a 3/6/9 bar → high-probability timing.
These bars are highlighted in green by default.
3️⃣ Filters & Display
You can customize:
Anchor time → when counting begins
Reset daily → restart counter each new trading day
Show only 3/6/9 → hides normal PT hits
Label offset → distance above the candle
Color themes
This makes the indicator usable on:
1Min
5Min
15Min
1H
Any timeframe you want
4️⃣ How To Apply It in Trading
Use it as a time confluence tool, not a signal generator.
✔ Best ways to use:
Look for MSS, sweeps, OB retests, FVG reactions when
they occur on or near a Prime-Time or 3/6/9 bar
Expect volatility increases after PT bars
Use 3/6/9 hits to anticipate internal turning points
Combine with:
Session High/Low
Killzones (London, NYO, PM)
Purge Protocol
MMXM Execution
✔ Example:
If price sweeps a level and prints a 3/6/9 vortex bar inside a PT window →
you have a very strong timing alignment for reversal.
5️⃣ Simple Summary
Feature Meaning
Prime-Time Hit (PT) Major time window where price often shifts
3/6/9 Vortex Bar Micro-timing for internal swings
PT + 3/6/9 together High-probability timing for entries
Reset Daily Perfect for intraday models like NYO & London
Anchor Time Defines the entire cycle structure

FPT - Key Levels with VWAP🔶 FPT – Key Levels with VWAP
This indicator combines multi-session VWAP, higher-timeframe key levels, market structure (HH/HL/LH/LL), and liquidity zones into one clean intraday tool.
Designed for scalping, day-trading, and session-based strategies such as Asia → London → New York flows.
🔵 Features
1. Multi-Session VWAP
Asia VWAP
London VWAP
New York VWAP
Daily reset
Optional deviations & clean mode
2. Key Levels (HTF SR Zones)
Automatically detects:
Previous Day High / Low
4H / 1H Key Levels
Session High / Low
Midpoints
Equal Highs & Equal Lows (liquidity lines)
3. Market Structure Engine
Swing points (HH, HL, LH, LL)
Break of Structure (BOS)
Market Structure Shift (MSS)
Optional minimal mode showing only breaks
4. Liquidity Tools
Buyside & sellside liquidity zones
Range high / low liquidity
Optional void / imbalance zones
5. Clean Visualization Mode
Removes unnecessary text
Shows only the essential levels
Perfect for chart posting or backtesting
🟩 Use Cases
Intraday key level mapping
VWAP deviation → mean reversion setups
Liquidity sweep → BOS/MSS setups
Session volatility filtering
Scalping and fast execution planning
⚠️ Disclaimer
This script does not provide financial advice.
It is for educational and analytical purposes only.
All trading decisions are solely your responsibility.

Dynamic Liquidity Levels [CDC Trading LABN] (ENGLISH)Script Description :
Take your market structure and liquidity analysis to the next level with Dynamic Liquidity Levels, a professional-grade tool designed to visualize the key levels that truly move the price. This indicator doesn't just plot static lines; it offers a dynamic framework that reacts to price action in real-time, keeping your chart clean and focused on what matters.
Designed for scalpers and swing traders alike, this indicator is your map for navigating market liquidity.
Key Features
• Smart Dynamic Lines: The standout feature of this indicator. Lines automatically stop extending once price has "invalidated" them. You decide whether the break occurs on a simple wick touch (to capture liquidity grabs) or a full candle close beyond the level (for a stronger confirmation).
• Comprehensive Liquidity Levels: Automatically draws the most important liquidity pools that professional traders watch every day:
• HTF Levels: Previous Day, Week, and Month Highs & Lows (PDH/L, PWH/L, PMH/L).
• Session Levels: Asian, London, and New York Session Highs & Lows (ASH/L, LSH/L, NYH/L).
• Full Label Control: Forget about overlapping labels. Adjust the position of each label individually (Left, Right, Center, Upper, Lower) for perfect visual clarity in any market condition.
• Instant, Configurable Alerts: Never miss an opportunity. Set up alerts that trigger the moment a level of your choice is broken, helping you execute your trades with precision.
• Clean & Professional Visualization: Fully customizable. Adjust colors, line width, and decide whether to display exact prices in the labels for an analysis setup tailored to your style.
Who is This Indicator For?
This tool is essential for a wide range of trading methodologies:
• Smart Money Concepts (SMC) & ICT Traders: Perfect for identifying liquidity pools and draw on liquidity levels. Use it to frame your order blocks and points of interest.
• Candle Range Theory (CRT) Traders: This indicator automates the core of your analysis. It identifies and projects the key candle ranges from higher timeframes (Daily, Weekly, Monthly) and trading sessions. Use these levels to anticipate price expansion and identify liquidity targets above and below established ranges, without manual markup every day.
• Price Action Traders: Clearly and automatically visualize the most relevant support and resistance levels based on high-timeframe market structure.
• Day Traders & Scalpers: Make quick decisions based on previous day's levels and session highs/lows, which act as magnets for intraday price.
• Swing Traders: Use the weekly and monthly levels to get a macro view of the structure and plan longer-term trades.
How to Use
1. Add the indicator to your chart.
2. Explore the settings panel to enable the levels and alerts that fit your trading plan.
3. Adjust the label positions for maximum clarity.
4. To receive alerts, right-click on the chart, create a new alert, select the indicator from the dropdown, and choose the "Any alert() function call" option.
We hope this tool greatly helps you improve your market analysis.
Happy trading!
CDC Trading LABN

Dynamic Liquidity Levels [CDC Trading LABN] (ESPAÑOL)Script Description :
Take your market structure and liquidity analysis to the next level with Dynamic Liquidity Levels , a professional-grade tool designed to visualize the key levels that truly move the price. This indicator doesn't just plot static lines; it offers a dynamic framework that reacts to price action in real-time, keeping your chart clean and focused on what matters.
Designed for scalpers and swing traders alike, this indicator is your map for navigating market liquidity.
Key Features
• Smart Dynamic Lines: The standout feature of this indicator. Lines automatically stop extending once price has "invalidated" them. You decide whether the break occurs on a simple wick touch (to capture liquidity grabs) or a full candle close beyond the level (for a stronger confirmation).
• Comprehensive Liquidity Levels: Automatically draws the most important liquidity pools that professional traders watch every day:
• HTF Levels: Previous Day, Week, and Month Highs & Lows (PDH/L, PWH/L, PMH/L).
• Session Levels: Asian, London, and New York Session Highs & Lows (ASH/L, LSH/L, NYH/L).
• Full Label Control: Forget about overlapping labels. Adjust the position of each label individually (Left, Right, Center, Upper, Lower) for perfect visual clarity in any market condition.
• Instant, Configurable Alerts: Never miss an opportunity. Set up alerts that trigger the moment a level of your choice is broken, helping you execute your trades with precision.
• Clean & Professional Visualization: Fully customizable. Adjust colors, line width, and decide whether to display exact prices in the labels for an analysis setup tailored to your style.
Who is This Indicator For?
This tool is essential for a wide range of trading methodologies:
• Smart Money Concepts (SMC) & ICT Traders: Perfect for identifying liquidity pools and draw on liquidity levels. Use it to frame your order blocks and points of interest.
• Candle Range Theory (CRT) Traders: This indicator automates the core of your analysis. It identifies and projects the key candle ranges from higher timeframes (Daily, Weekly, Monthly) and trading sessions. Use these levels to anticipate price expansion and identify liquidity targets above and below established ranges, without manual markup every day.
• Price Action Traders: Clearly and automatically visualize the most relevant support and resistance levels based on high-timeframe market structure.
• Day Traders & Scalpers: Make quick decisions based on previous day's levels and session highs/lows, which act as magnets for intraday price.
• Swing Traders: Use the weekly and monthly levels to get a macro view of the structure and plan longer-term trades.
How to Use
1. Add the indicator to your chart.
2. Explore the settings panel to enable the levels and alerts that fit your trading plan.
3. Adjust the label positions for maximum clarity.
4. To receive alerts, right-click on the chart, create a new alert, select the indicator from the dropdown, and choose the "Any alert() function call" option.
We hope this tool greatly helps you improve your market analysis.
Happy trading!
CDC Trading LABN

Lightning Session LevelsLightning Session Levels (LSL) draws clean, non-repainting levels for the major market sessions and a compact HUD in the top-right corner. It’s built to be lightweight, readable, and “set-and-forget” for intraday traders.
What it shows
Session High/Low and Open/Close levels for:
ASIA (00:00–08:00 UTC)
EUROPE (07:00–16:00 UTC)
US (13:30–20:00 UTC)
OVERNIGHT (20:00–24:00 UTC)
HUD panel:
Current active session
Countdown to the next US session (auto-calculated from UTC)
How it works (non-repainting)
Levels are anchored at session close. Each line is created once on the confirmed closing bar of the session (x2 = session end).
Optional Extend Right keeps the level projecting forward without changing the anchor (no “drifting”).
All drawings are pinned to the right price scale for stable reading.
Inputs
Show HUD — toggle the top-right panel.
Show Levels — master switch for drawing levels.
Draw High/Low — H/L session levels.
Draw Open/Close — O/C session levels.
Extend Right — extend all session lines to the future.
Keep N past sessions per market — FIFO limit per session group (default 12).
ASIA / EUROPE / US / OVERNIGHT — enable/disable specific sessions.
Style & palette
Consistent “Lightning” colors:
ASIA = Cyan, EUROPE = Violet, US = Amber, OVERNIGHT = Teal
Labels are always size: Normal for readability.
HUD uses a dark, subtle two-tone background to stay out of the way.
Recommended use
Timeframes: intraday (1m → 4h).
On 1D and higher, TradingView’s session-window time() filters won’t match intraday windows, so levels won’t plot (by design).
Markets: crypto, indices, FX, equities — any symbol where intraday session context helps.
Notes & limitations
Fixed UTC windows. The US window is set to 13:30–20:00 UTC. Daylight-saving shifts (DST) are not auto-adjusted; if you need region-specific DST behavior, treat this as a consistent UTC model.
The HUD timer counts down to the next US open from the current UTC clock.
Draw limits are capped (500 lines, 500 labels) for performance and stability.
Quick start
Add Lightning Session Levels to your chart.
Toggle Draw High/Low and/or Draw Open/Close.
Turn on Extend Right if you want the levels to project forward.
Enable only the sessions you care about (e.g., just EUROPE and US).
Use Keep N past sessions to control clutter (e.g., 6–12).
Disclaimer
This tool is for educational/informational purposes only and is not financial advice. Past session behavior does not guarantee future results. Always manage risk.

FVG Session Break Strategy with ATR RR🧠 FVG Session Break Strategy with ATR RR — Timezone-Aware, Session-Savvy, and Risk-Calibrated
This strategy captures high-probability reversals and continuations by combining Fair Value Gap (FVG) imbalances with session-based breakout logic and ATR-calibrated risk management. It’s designed for traders who want to exploit structural inefficiencies during key market sessions — with precision and portability across global exchanges.
🔍 Core Logic:
Fair Value Gap Detection: Identifies bullish and bearish FVGs using a 3-bar displacement pattern.
Session Breakout Engine: Tracks session highs and lows (Asian, London, NY) and triggers trades only when price breaks these levels — ensuring trades occur at meaningful inflection points.
ATR-Based RR Control: Dynamically sizes stop-loss and take-profit levels using ATR × multiplier, maintaining consistent risk across volatility regimes.
🌐 Timezone-Aware Session Logic:
Session boundaries are defined in UTC-5 (e.g., NY: 0930–1600) but automatically converted to the exchange’s local timezone using timestamp("Etc/GMT+5", ...). This ensures:
Accurate session detection across all markets and assets
No manual timezone adjustments needed
Robust performance on crypto, forex, and global equities
📈 Visuals:
Session highs and lows plotted in orange
Bullish and bearish FVGs marked with green and red triangles
Strategy entries and exits shown on chart with full RR logic
This strategy is ideal for traders who want to combine structural edge with session context and disciplined risk.

iFVG Strategie by Futures.RobbyiFVG Strategy Checklist by Futures.Robby
Updated: October 27, 2025
Description
This script is a manual checklist designed to help traders evaluate their setups based on the iFVG (Fair Value Gap) strategy. It serves solely as a visual aid and does not perform automatic analysis, signal generation, or trade execution.
How It Works
The script creates an interactive checklist directly on the chart. Traders manually select which criteria are met, and the script calculates a percentage score, displaying it with color coding:
Green (≥ 60%): Good fulfillment of criteria
Orange (40–59%): Partial fulfillment
Red (< 40%): Poor fulfillment
Checklist Criteria
The checklist is divided into two main sections:
1. Trade Criteria (8 Points)
Eight manually selectable criteria to assess setup quality:
Trade im Bias → Trade in Bias: Trade follows the higher timeframe trend (H1/H4/Daily).
BE Level → BE Level: Swing point between entry and target.
Sweep → Sweep: Price hits a key swing before reversing.
Displacement → Displacement: iFVG broken by strong candles.
Leg FVG geschlossen → Leg FVG Closed: No open m1 to m5 FVGs to target.
FVG Reaktion → FVG Reaction: Reaction at FVG during sweep (HTF).
FVG Größe → FVG Size: 6 to 10 points.
Anzahl Kerzen → Number of Candles: Maximum of 6 candles.
2. Goals (1 Point)
Six optional goal conditions, counted together as 1 point:
Equal H / L → Equal High/Low
Session H / L → Session High/Low
News H / L → News High/Low
HTF Swing Point → HTF Swing Point
HTF OB → HTF Order Block
HTF FVG → HTF FVG
Settings and Customization
The script’s settings are translated as follows:
Group: Trade Criteria
Trade im Bias → Trade in Bias
Tooltip: Trendrichtung folgt HTF (H1/H4/Täglich) – Trend follows HTF direction
BE Level → BE Level
Tooltip: Swingpunkt zwischen Einstieg und Ziel – Swing point between entry and target
Sweep → Sweep
Tooltip: Kurs erreicht markanten Swing – Price hits key swing before inverse
Displacement → Displacement
Tooltip: iFVG durch starke Kerzen gebrochen – iFVG broken by strong candles
Leg FVG geschlossen → Leg FVG Closed
Tooltip: Keine offenen m1 bis m5 FVGs bis Ziel – No open m1 to m5 FVGs to target
FVG Reaktion → FVG Reaction
Tooltip: Reaktion an FVG beim Sweep (HTF) – Reaction at FVG during sweep (HTF)
FVG Größe → FVG Size
Tooltip: 6 bis 10 Punkte – 6 to 10 points
Anzahl Kerzen → Number of Candles
Tooltip: Maximal 6 Kerzen – Maximum of 6 candles
Group: Goals
Equal H / L → Equal High/Low
Session H / L → Session High/Low
News H / L → News High/Low
HTF Swing Point → HTF Swing Point
HTF OB → HTF Order Block
HTF FVG → HTF FVG
ℹ️ Ziele zählen gemeinsam als 1 Punkt → ℹ️ Goals count together as 1 point
Window Position & Size
Fensterposition → Window Position
oben rechts → top right
oben links → top left
unten rechts → bottom right
unten links → bottom left
Tabellengröße → Table Size
normal → normal
small → small
tiny → tiny
Translation of Chart Table Contents
The table headers and entries on the chart are translated as follows:
Table Headers:
Trade Checkliste → Trade Checklist
Ziele → Goals
Status Symbols:
✅ → ✅ (Fulfilled)
❌ → ❌ (Not fulfilled)
Individual Criteria (Trade Criteria):
Trade im Bias → Trade in Bias
BE Level → BE Level
Sweep → Sweep
Displacement → Displacement
Leg FVG geschlossen → Leg FVG Closed
FVG Reaktion → FVG Reaction
FVG Größe → FVG Size
Anzahl Kerzen → Number of Candles
Individual Criteria (Goals):
Equal H / L → Equal High/Low
Session H / L → Session High/Low
News H / L → News High/Low
HTF Swing Point → HTF Swing Point
HTF OB → HTF Order Block
HTF FVG → HTF FVG
Note Line:
Ziele zählen gemeinsam als 1 Punkt → Goals count together as 1 point
Important Note
This tool is not an automated indicator, but a visual decision aid for traders who want to apply their strategy in a structured and conscious way.

Уровни SL/TP и значение ATR первого часаSession Range SL/TP Levels with Advanced ATR
Overview
The Session Range SL/TP Levels indicator is a comprehensive tool designed for session-based trading strategies, particularly for breakouts. It identifies the high and low of a user-defined time range (e.g., the Asian session) and uses a sophisticated, customizable Average True Range (ATR) calculation to project key Stop Loss (SL) and Take Profit (TP) levels.
This indicator helps traders visualize potential entry and exit points based on the volatility of a specific trading session, with all crucial data presented in a clean on-screen table.
Key Features
Customizable Trading Session: Define any time range to establish your core trading zone. The indicator will automatically find the high and low of this period.
Advanced ATR Calculation: The indicator uses an ATR calculated on a 5-minute timeframe for higher precision. You can customize:
The ATR length and smoothing method (RMA, SMA, EMA, WMA).
A unique percentage reduction from the ATR to create a more conservative volatility buffer.
Volatility-Based SL/TP Levels: Automatically calculates and plots multiple SL and TP levels for both long and short scenarios based on user-defined multipliers of the modified ATR.
Comprehensive On-Screen Display: A detailed on-screen table provides all critical data at a glance, including:
The original 5-min ATR value.
The modified ATR after the percentage reduction.
Three custom ATR-multiple values for quick reference.
All calculated SL and TP price levels for both Long and Short setups.
Copy-Friendly Data Logging: With a single click in the settings, you can print all calculated values into the Pine Logs panel, allowing for easy copying and pasting into other applications or trading journals.
How to Use
Define Your Session: In the settings, enter the time for the trading session you want to analyze (e.g., "0200-0300" for a part of the Asian session).
Identify the Range: The indicator will draw the high and low of this session once the time period is complete.
Plan Your Trade: The calculated levels provide potential targets for breakout trades.
For a Long Trade: If the price breaks above the session high, the green Take Profit lines (TP1, TP2, TP3) serve as potential exit points, while the Stop Loss (Long) level serves as a volatility-based stop.
For a Short Trade: If the price breaks below the session low, the red Take Profit lines serve as potential targets, with the Stop Loss (Short) level as the corresponding stop.
Reference the Table: Use the on-screen table to see the exact price levels and ATR values without needing to hover over the lines.
Keks Key Level Fx SessionsThis script is designed to automatically plot and manage key levels for the major FX trading sessions (London, New York, and Asia). It helps traders identify the most relevant price areas that often act as support, resistance, or breakout zones during active market hours.
Key features:
Marks session highs, lows, and midpoints
Visualizes key intraday levels for better market structure analysis
Highlights potential breakout and retest areas
Works across multiple timeframes for flexibility
Clean and minimal chart design to avoid clutter
This tool is especially useful for traders who rely on session-based strategies, such as breakout trading, retests, or range trading, by providing a clear visual guide to the most important price zones.

Liquidity Sweep ReversalOverview
The Liquidity Sweep Reversal indicator is a sophisticated intraday trading tool designed to identify high-probability reversal opportunities after liquidity sweeps occur at key market levels. Based on Smart Money Concepts (SMC) and Institutional Order Flow analysis, this indicator helps traders catch market reversals when stop-loss clusters are hunted.
Key Features
🎯 Multi-Level Liquidity Analysis
Previous Day High/Low (PDH/PDL) detection
Previous Week High/Low (PWH/PWL) tracking
Session highs/lows for Asian, London, and New York markets
Real-time level validation and usage tracking
⚡ Advanced Signal Generation
CISD (Change In State of Delivery) detection algorithm
Engulfing pattern recognition at key levels
Liquidity sweep confirmation system
Directional bias filtering to avoid false signals
⏰ Kill Zone Integration
Pre-configured optimal trading windows
Asian Kill Zone (20:00-00:00 EST)
London Kill Zone (02:00-05:00 EST)
New York AM/PM Kill Zones (08:30-11:00 & 13:30-16:00 EST)
Optional kill zone-only trading mode
🛠 Customization Options
Multiple timezone support (NY, London, Tokyo, Shanghai, UTC)
Flexible HTF (Higher Time Frame) selection
Adjustable signal sensitivity
Visual customization for all levels and signals
Hide historical signals option for cleaner charts
How It Works
The indicator continuously monitors price action around key liquidity levels
When price sweeps liquidity (stop-loss hunting), it marks potential reversal zones
Confirmation signals are generated through CISD or engulfing patterns
Trade signals appear as arrows with color-coded candles for easy identification
Best Suited For
Intraday traders focusing on 1m to 15m timeframes
Smart Money Concepts (SMC) practitioners
Scalpers looking for high-probability reversal entries
Traders who understand liquidity and market structure
Usage Tips
Works best on liquid forex pairs and major indices
Combine with volume analysis for stronger confirmation
Use proper risk management - not all signals will be winners
Monitor higher timeframe bias for better accuracy
==============================================
日内流动性掠夺反向开单指标
指标简介
这是一款基于Smart Money概念(SMC)开发的高级日内交易指标,专门用于识别市场在关键价格水平扫除流动性后的反转机会。通过分析机构订单流和流动性分布,帮助交易者精准捕捉止损扫单后的市场反转点。
核心功能
多维度流动性分析
前日高低点(PDH/PDL)自动标记
前周高低点(PWH/PWL)动态跟踪
亚洲、伦敦、纽约三大交易时段高低点识别
关键位使用状态实时监控,避免重复信号
智能信号系统
CISD(Change In State of Delivery)算法检测
关键位吞没形态识别
流动性扫除确认机制
方向过滤系统,大幅降低虚假信号
黄金交易时段
内置Kill Zone时间窗口
支持亚洲、伦敦、纽约AM/PM四个黄金时段
可选择仅在Kill Zone内交易
时区智能切换,全球交易者适用
个性化设置
支持多时区切换(纽约/伦敦/东京/上海/UTC)
HTF周期自动适配或手动选择
信号灵敏度可调
所有图表元素均可自定义样式
历史信号隐藏功能,保持图表整洁
适用人群
日内短线交易者(1分钟-15分钟)
SMC交易体系践行者
追求高胜率反转入场的投机者
理解流动性和市场结构的专业交易者
使用建议
推荐用于主流加密货币、外汇对和股指期货
配合成交量分析效果更佳
严格止损,理性对待每个信号
关注更高时间框架的趋势方向
风险提示: 任何技术指标都不能保证100%准确,请结合自己的交易系统和风险管理使用。

Session Open Candle MarkerThe "Session Open Candle Marker" is a Pine Script indicator designed for forex and futures traders using Smart Money Concepts (SMC) and RP Profits-inspired strategies. It marks the 15-minute opening range candles for the Asia, London, and NY sessions, where institutional "big players" often gather liquidity. Each session’s range is drawn as a rectangle with a customizable midpoint line, ideal for spotting breakouts, retests, and liquidity sweeps.
Features
Session Open Ranges: Plots rectangles for the 15m open candles of Asia (03:00 EEST), London (10:00 EEST), and NY (15:00 EEST), corresponding to 01:00, 08:00, and 13:00 GMT+1.
Customizable Visualization:
Toggle each session (Asia, London, NY) on/off.
Independent high/low label toggles for each session.
Adjustable rectangle color, midpoint line color, style (solid/dashed/dotted), and width.
Customizable rectangle duration (default: 96 bars, ~24 hours on 15m).
Timezone Flexibility: Default times are set for EEST (UTC+3). Adjust session inputs for your chart’s timezone (e.g., GMT+1: Asia 01:00, London 08:00, NY 13:00; UTC: Asia 00:00, London 07:00, NY 12:00).
Clean Design: Rectangles and labels update dynamically, with proper cleanup to avoid clutter.
Usage:
Setup: Add to a 15m chart (e.g., EURUSD, ES1!). Check your chart’s timezone (Chart Settings > Symbol > Timezone) and adjust session times if needed.
Settings:
Toggle sessions and labels to focus on desired ranges (e.g., London and NY for high volatility).
Customize colors, midpoint line style/width, and rectangle duration.
Trading:
Breakouts/Retests: Trade breakouts above/below the rectangle high/low, with retests back to the range or midpoint (aligned with RP Profits scalping).
Liquidity Sweeps: Watch for price sweeping session highs/lows, reversing for entries (SMC concept).
